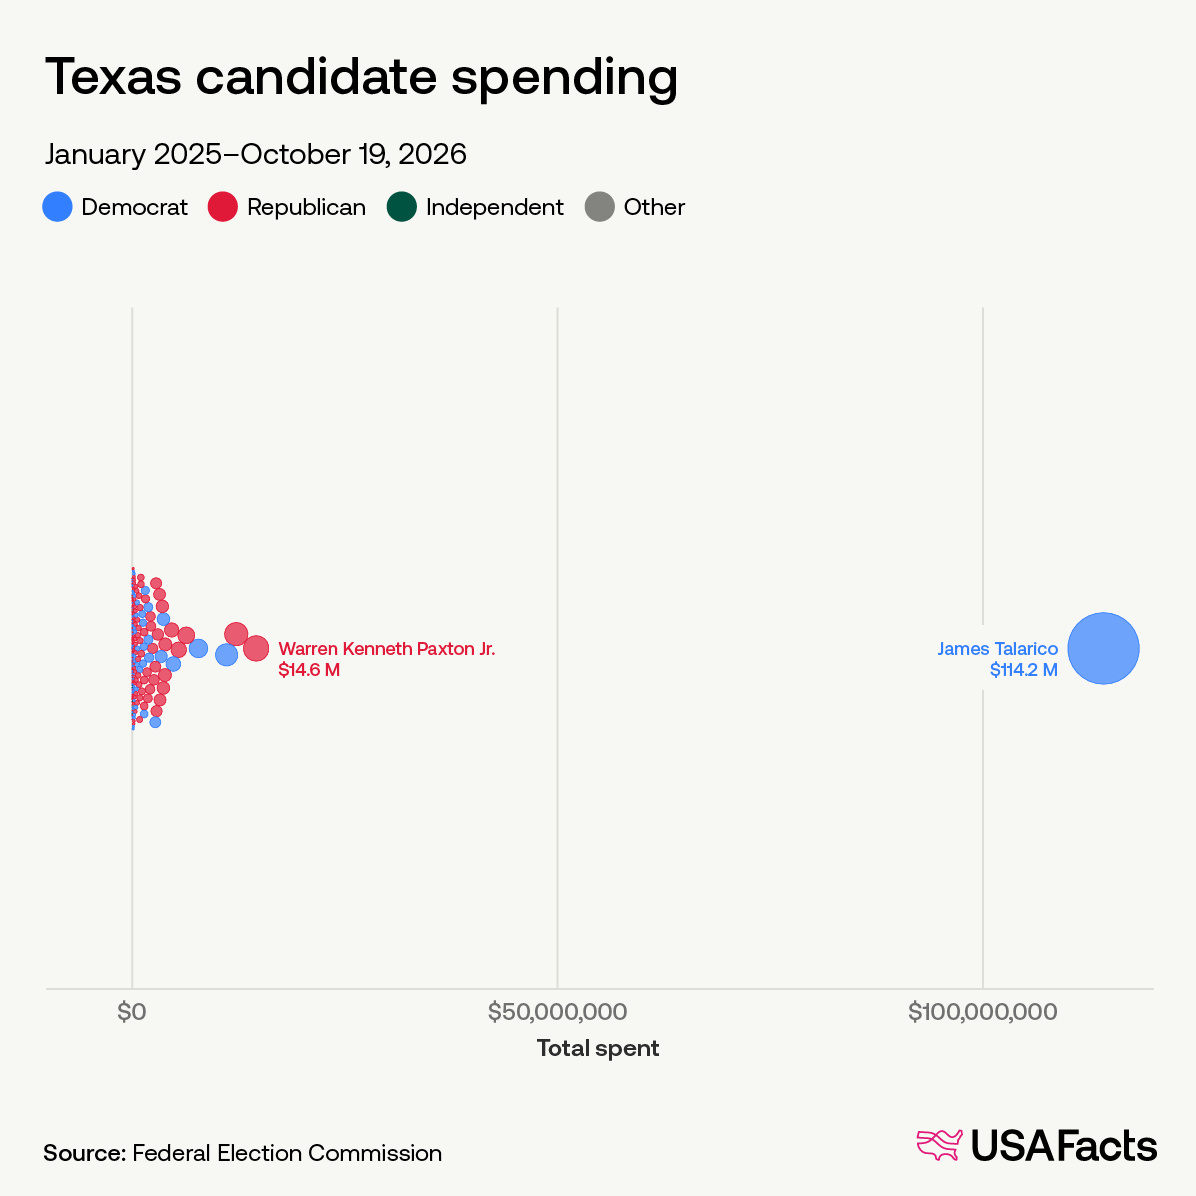
Incumbent House Speaker Mike Johnson (R-Louisiana) has raised the most of all Republican candidates: $24.2 million. His campaign has raised the tenth-highest sum of all candidates, behind nine Democrats.
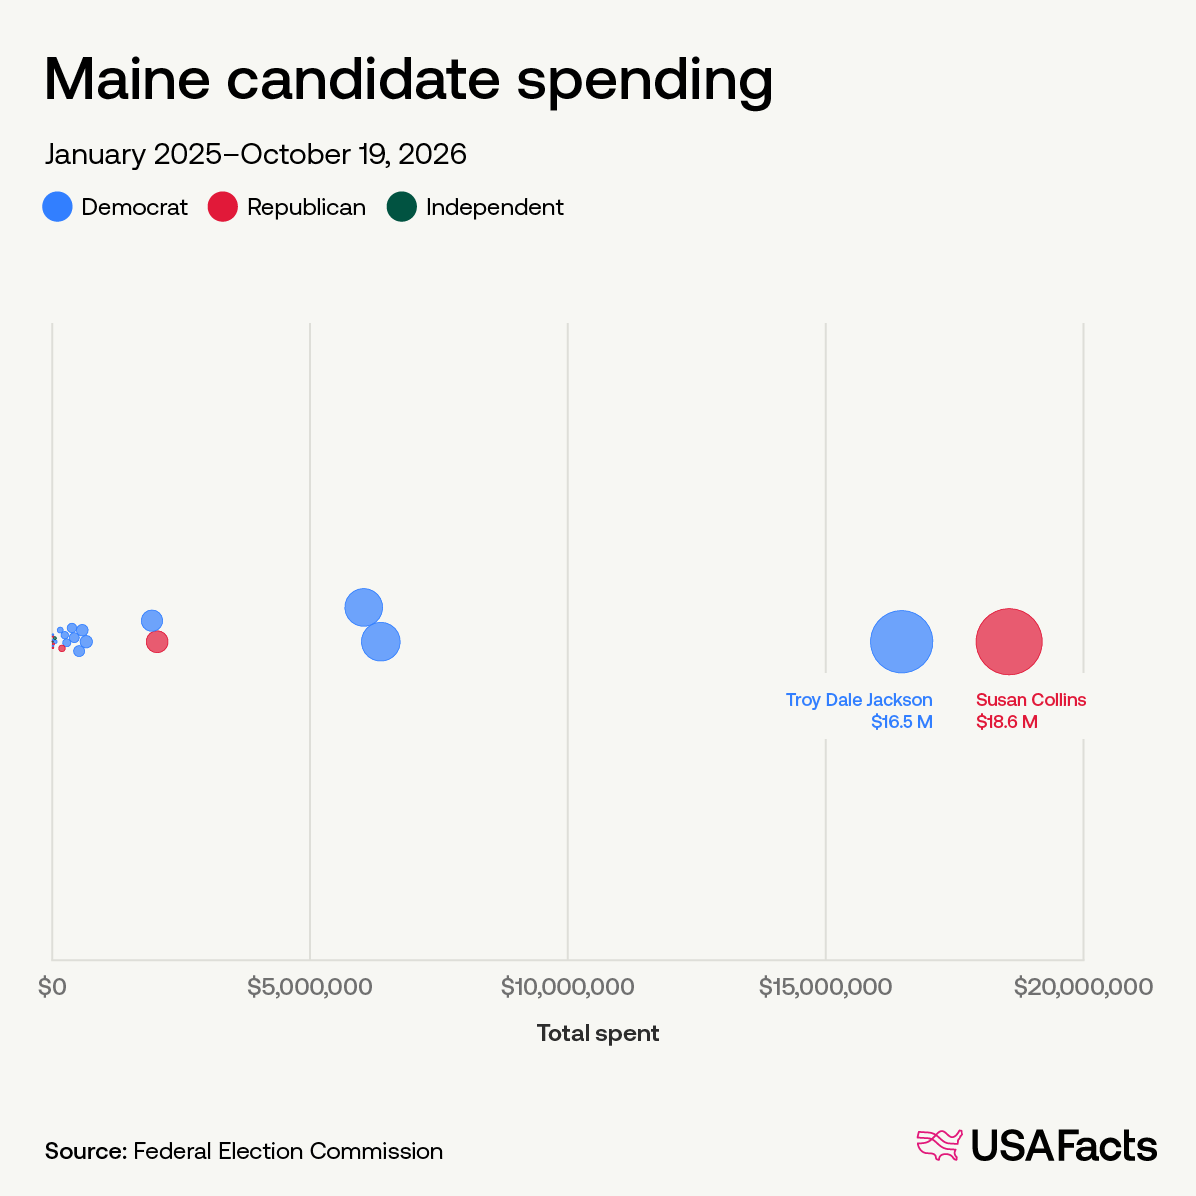
FEC filings also show that the campaign of the late Senator Lindsey Graham (R-South Carolina) is the highest-spending Republican campaign for the 2025–2026 election cycle, at nearly $22.2 million. This data covers all candidates, including those who have lost primaries or caucuses, withdrawn their candidacies, or, in Senator Graham's case, passed away during the campaign.
Incumbent Senator Susan Collins (R-Maine) is the second-highest spending Republican candidate, at nearly $18.6 million.
|
|
Senate candidates have spent a total of $1.03 billion on 2026 races. Of that, candidates running to represent Texas and Georgia have spent the most of all states, $156.8 million and $109.7 million, respectively.
House candidates have spent a combined total of $1.83 billion. Maryland’s 6th District is where the most money is flowing: candidates there have spent a combined $38.7 million. Most of that spending was by Democratic challenger David Trone ($25 million) and Democratic incumbent April McClain Delaney ($12.4 million).
We’re updating this data weekly through Election Day. Check the site for the latest. And for more on how this system works, watch this video we made with Crash Course!
|
|
All of our election data in one place |
|
Midterm election season brings more claims, spin, and noise than almost any other moment on the civic calendar. Luckily, we’re here to provide clear data on the midterms and how elections work. We're your calm amidst election chaos. Elections come and go, but we’ll keep doing what we always do: bring you crucial civic data in plain language on the topics that matter to you. |
|
Explaining gerrymandering |
|
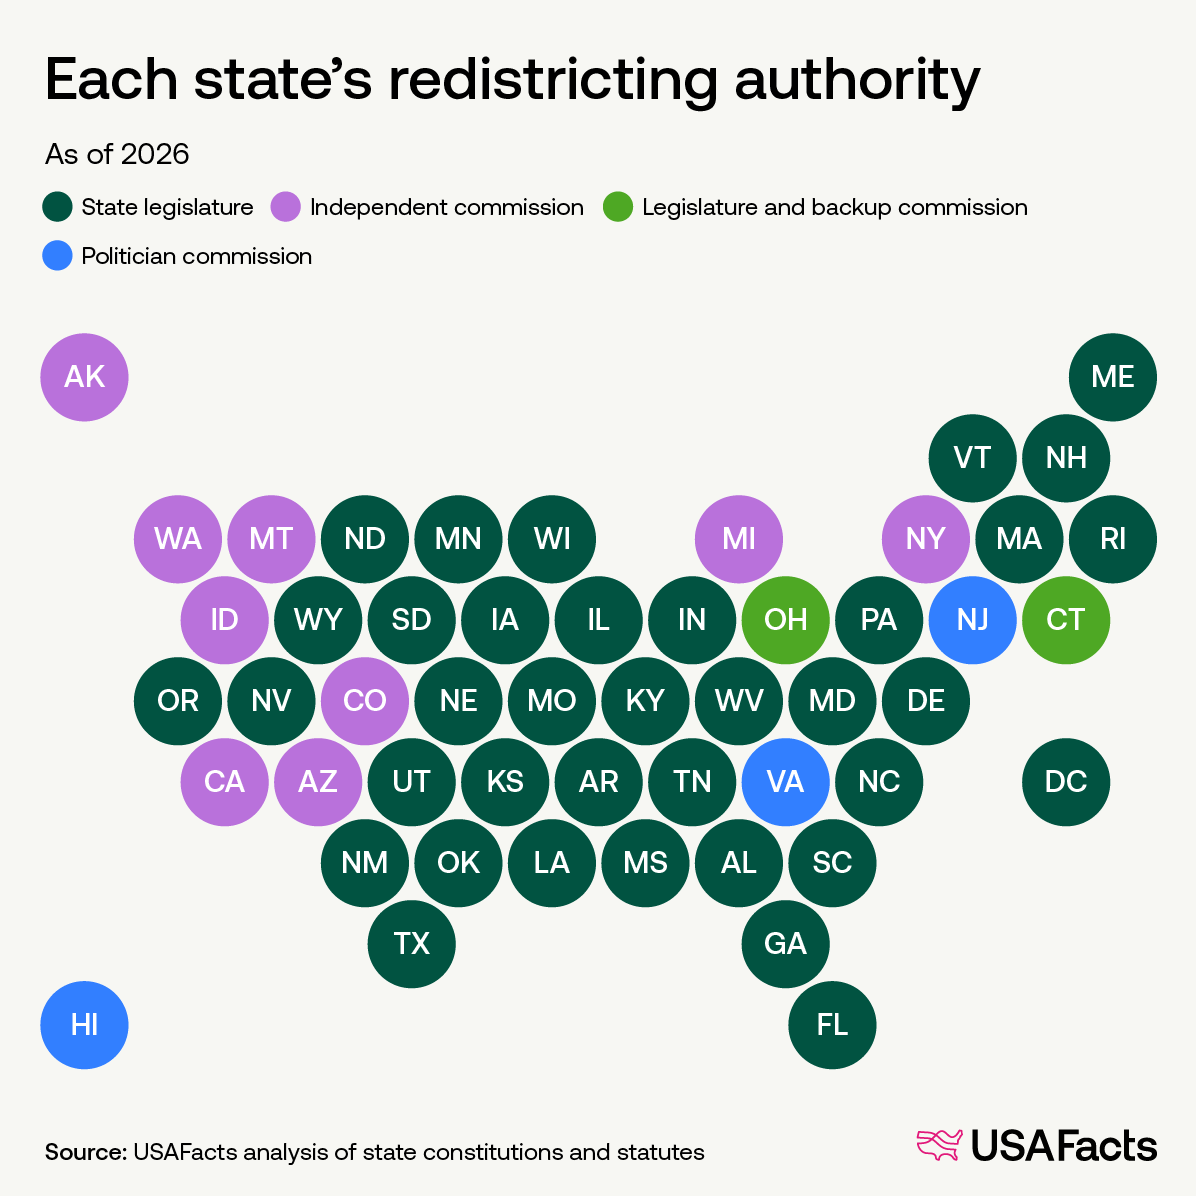
Every 10 years, the Census Bureau counts the entire US population. A population growth or decline relative to the rest of the country can change how many seats each state has in the House. And how many districts states have — and their shapes — change as a result. When maps are designed to give one political party or group a specific advantage, it’s called gerrymandering. But states don’t have to wait 10 years, nor for population changes, to adjust district borders. Nine states have different congressional districts than they did in 2024. Is your state among them? |
|
Federal law requires districts within a state to have populations that are nearly as equal as possible. This rule aims to uphold the “one person, one vote” principle from Article I, Section 2 of the Constitution.
Section 2 of the federal Voting Rights Act prohibits district maps that unlawfully weaken the voting power of racial and covered language-minority groups. Where specific demographic and legal criteria are met, mapmakers have drawn “majority-minority” districts in which a racial or language minority group constitutes most of the voting-age population. (See diagrams on how this works in the article.)
The 14th Amendment’s Equal Protection Clause limits how much states can rely on race when drawing district lines. In Louisiana v. Callais (2026), the Supreme Court held that Louisiana could not justify making race the predominant factor in drawing a district because the Voting Rights Act did not require the state to create that majority-minority district.
In some states, districts are required to be compact. This means district residents live as close to one another as reasonably possible. A compact district favors regular, consolidated shapes over long, narrow, or jagged designs. Some states require districts to be contiguous, some don’t. In a contiguous district, someone can travel from any point in the district to another without entering a different one. (We of course have diagrams illustrating both concepts.)
Federal courts generally can’t strike down a map solely on the ground of partisan gerrymandering. But several states prohibit drawing districts designed to favor or disfavor a political party, incumbent legislator, or candidate.
There are many more rules, most at the state level. And do we have diagrams explaining those too? You bet. |
|
Use Claude? Love gov data? Use our connector |
|
USAFacts is here to make government data easier to find and understand. That means showing up where people need us. Increasingly, that's in AI tools. So, we created the USAFacts Government Data Connector. It’s in the experimental stages, but our aim is to bring the same nonpartisan data into Claude, so you can see where each number comes from and judge it yourself. If you’re a Claude user, learn how to install our connector here. Why not start by asking it about unemployment in your state? Share your feedback on the Claude Connector; good, bad, or mixed, it doesn't matter: we want your honest opinion! |
|
Teachers: last call for ISKME fellowships |
|
Build a classroom lesson plan with real government data as part of our Open Educational Resources fellowship with the Institute for the Study of Knowledge Management in Education. Applications close November 4! |
|
On October 19, President Trump announced the creation of the Harvest Fuel Relief Program, which will provide $8 billion in one-time payments to farmers this harvest season, primarily to help with higher fuel prices.
Last week, Chiricahua National Park in southeast Arizona became America's 64th national park. How will it keep up with the rest in contributing to it's local economy? Time for a quick mental workout: the weekly fact quiz is here. |
|
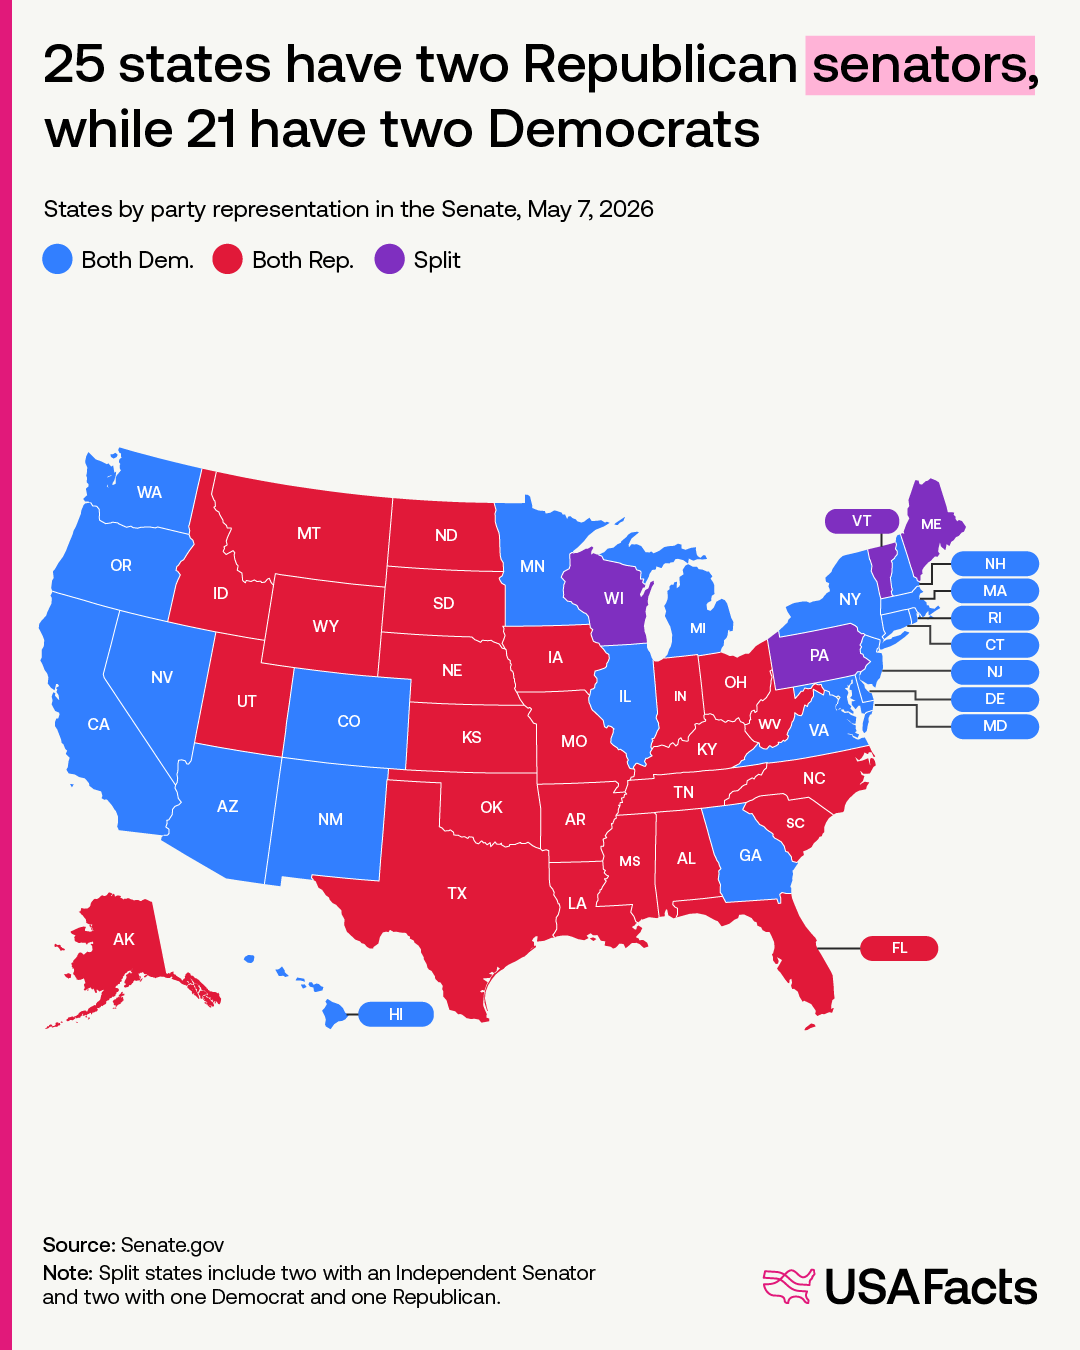
A senatorial snapshot ahead of the midterms: 25 states currently have a pair of Republican senators, 21 states have a pair of Democratic senators, and four have some combination of Republican, Democrat, and independent senators. This data is from before Republican Senator Lindsey Graham’s passing. However, he was replaced by his sister, Darlene Graham, a fellow Republican. |
|
this newsletter to a friend! |
|
|
|
Was this email forwarded to you? Sign up for your own weekly issue of the USAFacts newsletter. |
|
|
|
|