Three big ones in this update. Filter groups let you save a set of filter values once, so you never have to rebuild a long filter again. Pivot tables got more powerful and more flexible, and now highlight what changed right in the cells. And you can edit any chart without leaving the dashboard it's on. We've also launched a series of short onboarding videos on YouTube. There's plenty more below, so let's dive in.
Filter groups: name a list of values once, use it everywhere
Some filters use the same long list every time: the countries in your EMEA region, the plans that count as paid, the internal accounts you leave out of customer numbers. You ticked them one by one in every chart, and when the list changed, you had to find every chart that used it.
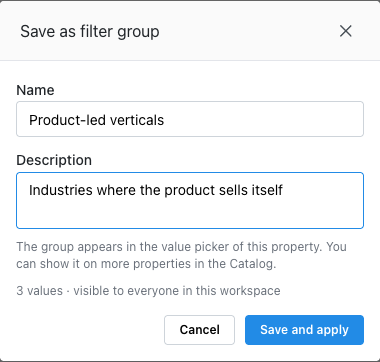
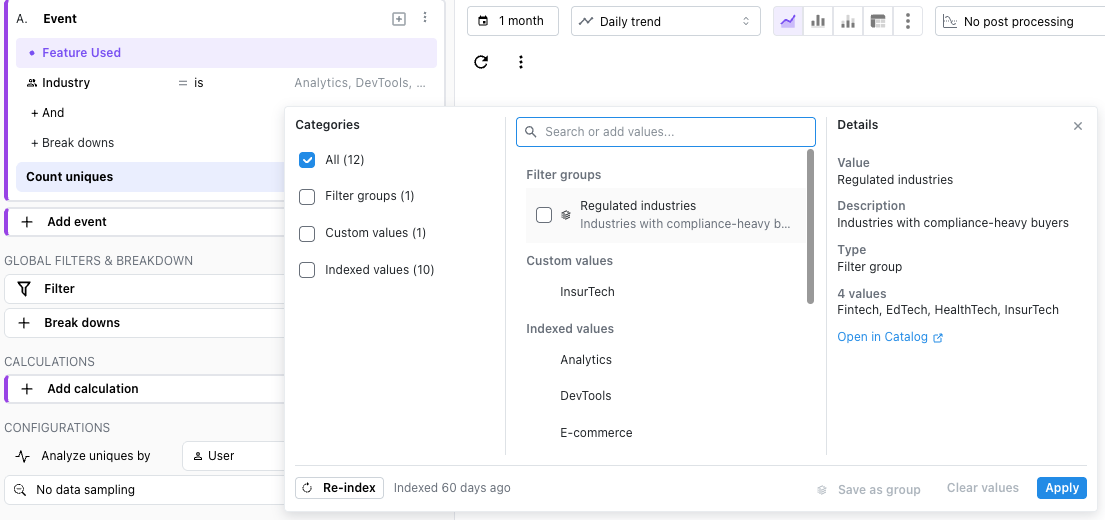
Now you can save that list as a filter group. Tick the values in a filter (or paste a list, one per line) and click Save as group at the bottom of the value picker. Give it a name and a short description, and it replaces the ticked values in your filter.
From then on, everyone in the workspace finds it under Filter groups in that property's value picker, next to the single values. Hover over it to see what's inside.
One edit updates every chart. Add a country to EMEA and every insight, dashboard filter, cohort and custom event that uses the group picks it up.
Works both ways. Use it with is to keep only those values, or with is not to leave all of them out.
Managed in one place.Workspace settings → Catalog → Filter groups lists every group with its values and where it's used, so you know what an edit or a delete will touch.
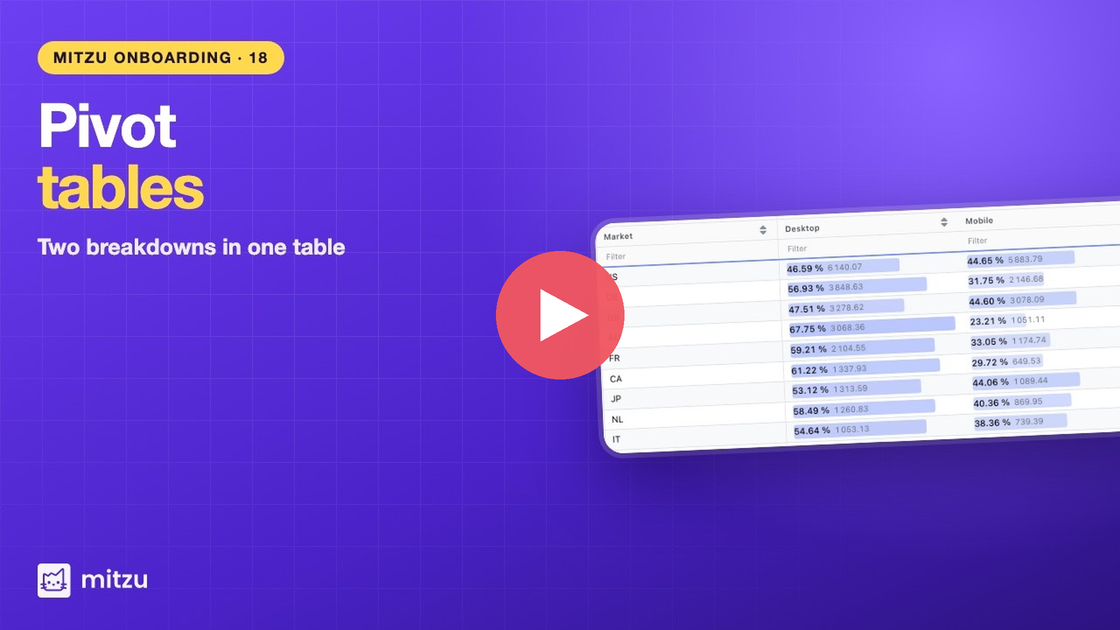
A pivot table puts one breakdown down the side, another across the top, and a number where they meet. Often, though, the raw number isn't the question. You want to know which country is growing fastest, or what share of sign-ups each campaign brings in.
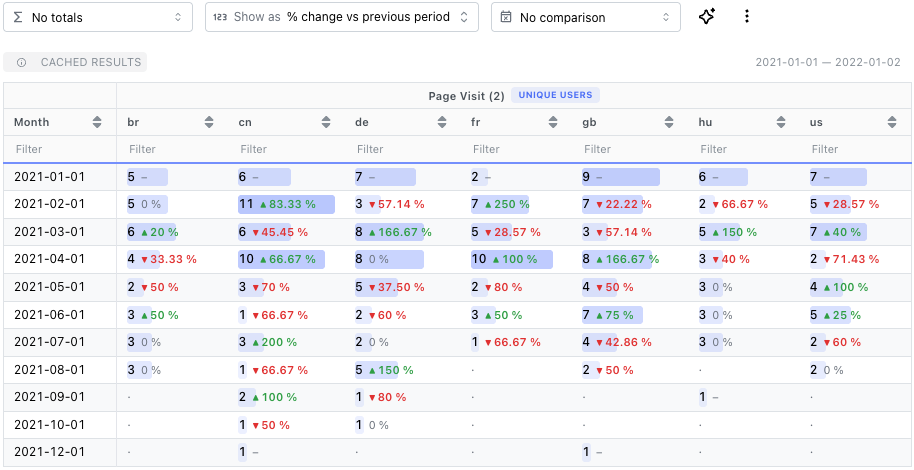
Now a pivot table can show you that directly. Pick an option from the new Show as menu next to Totals:
% change vs previous period: each cell keeps its value and adds a green ▲ or red ▼ with the change since the previous period. On a monthly pivot of sign-ups by country, the countries that grew and the ones that dropped stand out at a glance.
% of row total or % of column total: each cell leads with its share. See what share of each month's subscriptions came from each plan, and whether that mix is shifting.
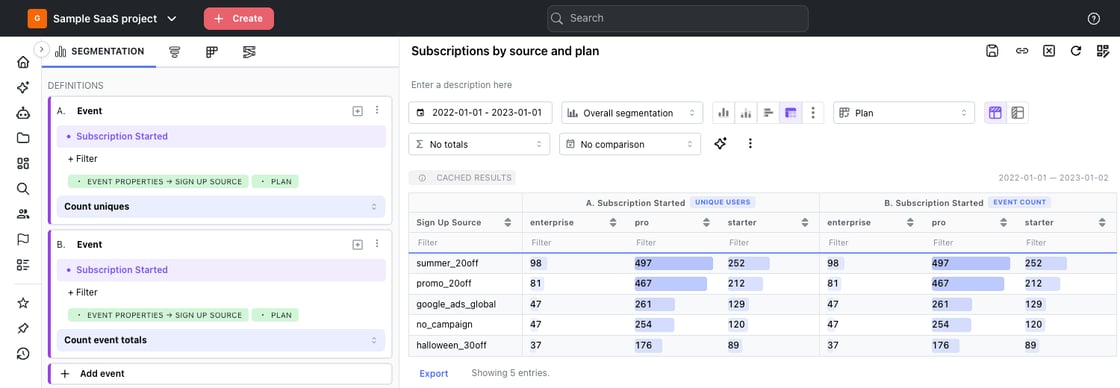
The layout is more flexible too. With two or more metrics, choose Metrics on top to give each metric its own group of columns, split by the breakdown you put across the top, or Metrics in rows to stack them. Totals follow the layout: with metrics on top, each metric gets its own Total or Average column instead of one total that adds everything together.
Your choices are saved with the insight, including the column you sorted by, and show up the same on dashboards, image exports and emailed reports.
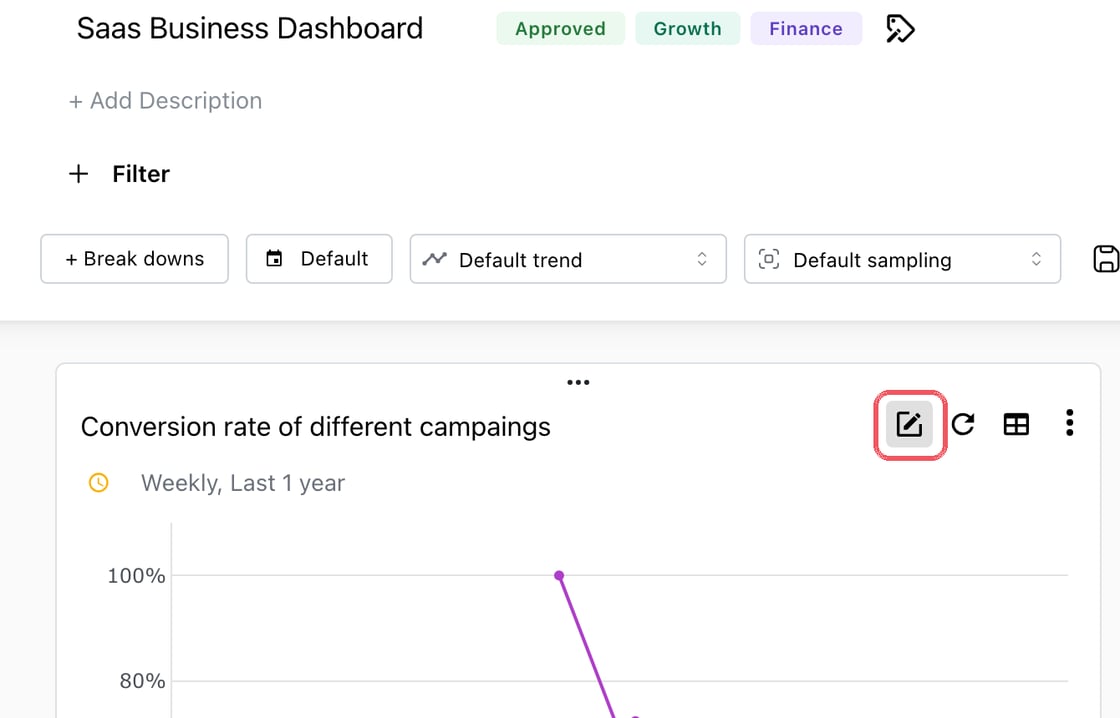
Fixing a chart on a dashboard used to mean opening it on a separate page, making the change, saving, and going back to check how it looked next to everything else.
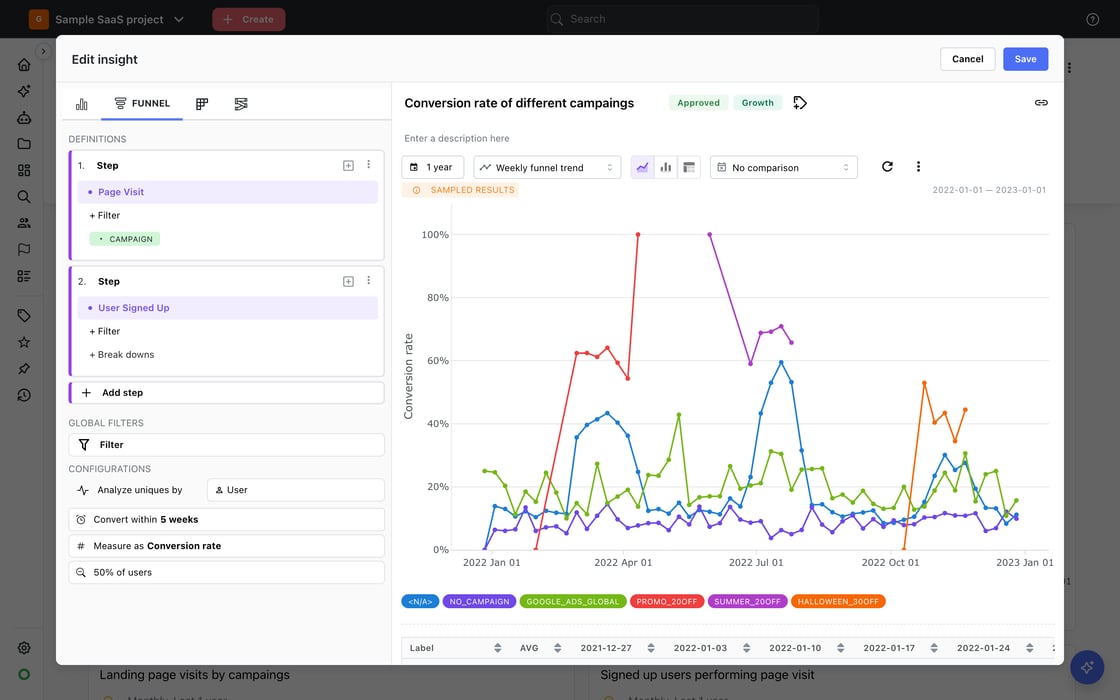
Now the editor opens on top of the dashboard. Click Edit on any card:
The full insight editor opens right there, with your dashboard still behind it. Save updates the chart and redraws just that card, and Cancel leaves everything as it was. To build something new, pick Add new insight from Add content, and it lands on the dashboard where you added it.
Distinct values per user: how many different things each user did
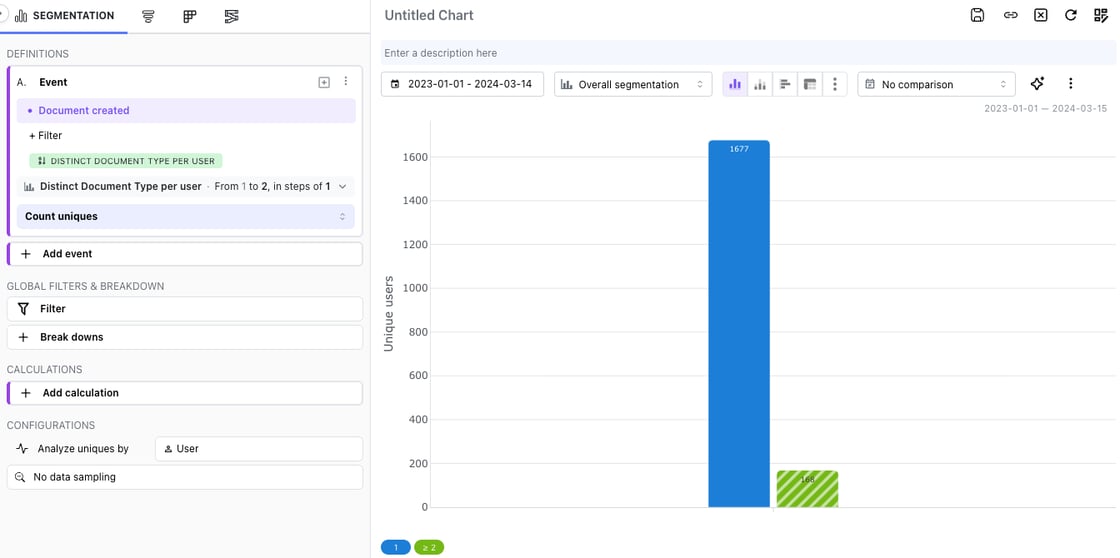
Some questions aren't about how often users did something, but how many different things they did it with. How many visitors used more than one device? How many customers created more than one type of document?
Now you can break down and filter by distinct values per user. In a segmentation, open the breakdown picker, choose the Distinct values category and pick a property. Each user lands in one group by how many different values of that property they had in the date range: 1, 2, 3 and so on. Turn on Bucket values to group them into ranges, such as 1 and 2 or more.
The same works as a filter: pick Distinct values under + Filter to keep only users who had, say, at least two different devices, and analyze what they did.
For now, distinct values are available in segmentation insights.
Getting a new teammate up to speed, or picking up a part of Mitzu you haven't used yet? We've published a series of 22 short videos that walk through Mitzu step by step: trends and topline numbers, funnels and exclusion steps, journeys, cohorts, pivot tables, metrics, and building dashboards with the agent.
Frequency breakdowns grouped into ranges. When you break down by how often users did an event, you can now group the counts into ranges like 1–5 and 6–10 instead of one bar per count. Docs
Workspace label colors. Pin a color to a value so it looks the same on every chart: iOS in the same blue on every dashboard, Slack image and emailed report. Set them in Settings → Workspace → Configuration → Label colors, from a chart's legend, or by asking the agent. Docs
Settings, reorganised. Settings now has three menus, Organisation, Workspace and Personal, so what you change is clear from where you are.
A faster agent. The agent now runs on Claude Sonnet 5.5 by default. In our tests it answered in about half the time.