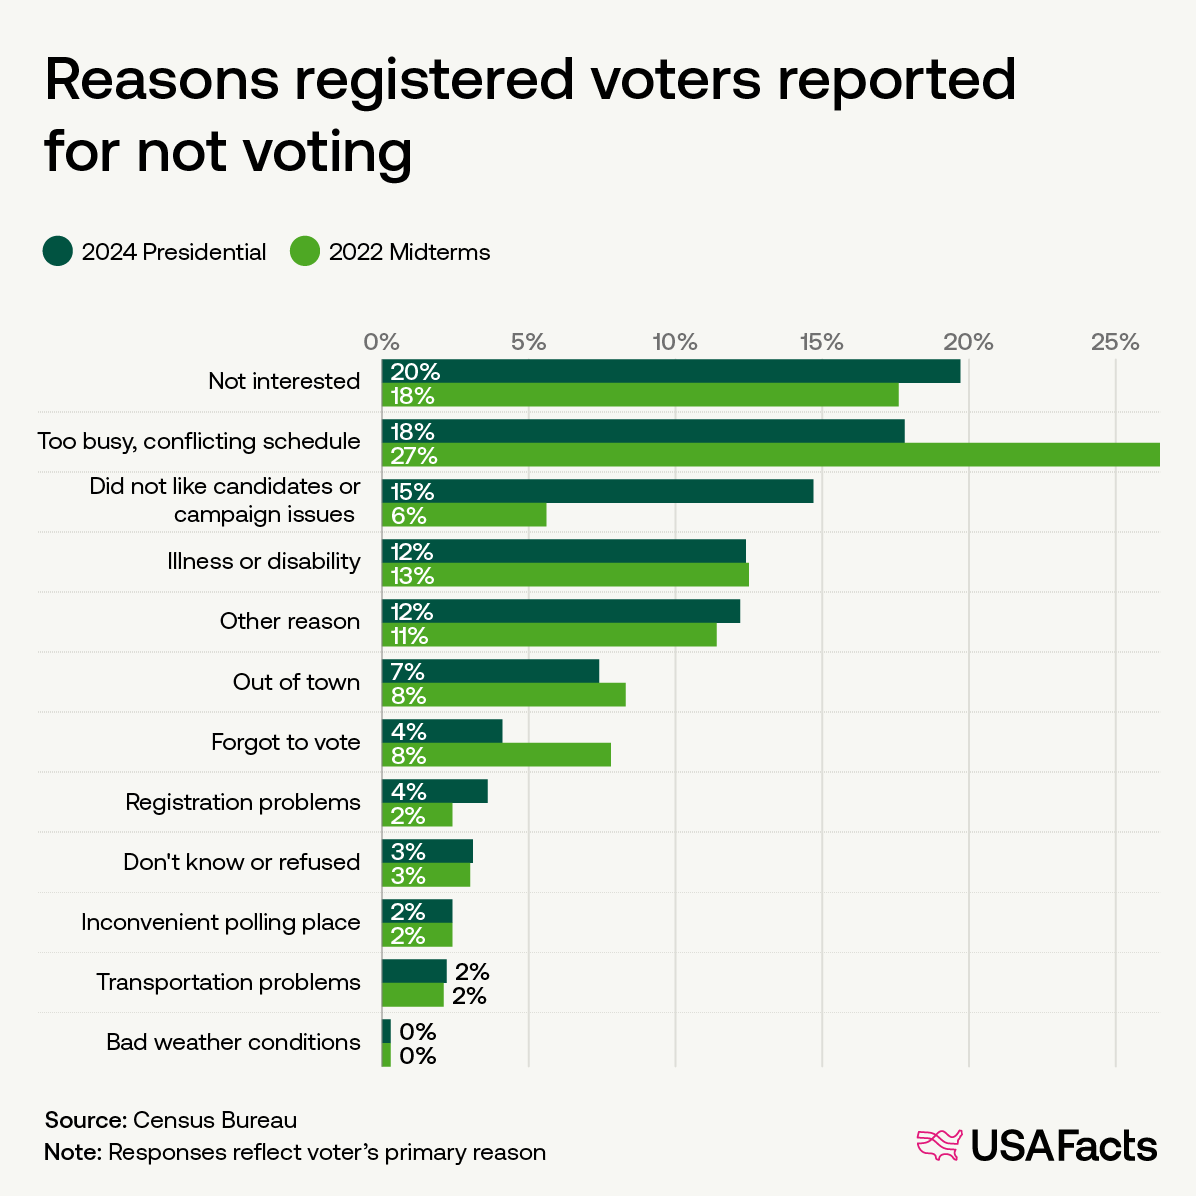
In 2024, 20% of respondents cited disinterest as the reason they didn't vote. That’s nearly double from 20 years earlier, when 11% said it was their main reason. It became the most common reason for non-voting in 2020.
Next came being too busy (18%) and disliking the candidates or issues (15%). Smaller percentages of non-voters cited being out of town (7%) and forgetting (4%).
Meanwhile, access to voting has improved. Registration problems (for example, a recent move causing an address discrepancy) fell from 7% of non-voters in 2004 to 4% in 2024. The share citing illness or disability as a reason not to vote fell from 15% to 12%.
As for midterms, around 37 million registered voters sat it out in 2022, which is more than twice the number in the presidential election year of 2024. They were more likely to cite a schedule conflict (27% in 2022 vs. 18% in 2024) or forgetting (8% vs 4%), and less likely to cite the candidates (6% vs 15%).
In the 2016 election, 25% of non-voters said they didn’t vote because they disliked the candidates, compared to 15% in 2024.
Want more? This new video from USAFacts and Crash Course dives deeper into the reasons why people don’t vote—and why they do!
|
|
Looking for a debate about just the facts? So were we. That's why we brought Ben Shapiro and Scott Galloway together to debate the American Dream using the same set of government data. You can watch it here. The result is a fact-based debate, moderated by PBS News Hour co-anchor and managing editor Geoff Bennet, about how the American Dream has evolved over the last 250 years due to economic forces, government programs, the housing market, and more. USAFacts Founder Steve Ballmer presents the data that shapes each round. The goal of this first Just the Facts debate isn't to tell people what to think. It's to give them trustworthy information to think with. We believe facts are for everyone, regardless of political perspective. |
|
How many registered Democrats and Republicans are there? |
|
As of September, 210.0 million people in the US are registered to vote. That’s nearly eight in 10 American residents 18 or older. But what states have the highest rates—and are those voters more affiliated with one party or another? Here’s what we can tell from recent data. Washington, DC, had the highest voter registration rate at 85.1%. Minnesota had the highest rate of any state: 83.6%. Oregon was close with 83.0%. Six other states had rates above 80%. Ten had rates below 70%. Arkansas's rate of 64.7% was the nation's lowest.
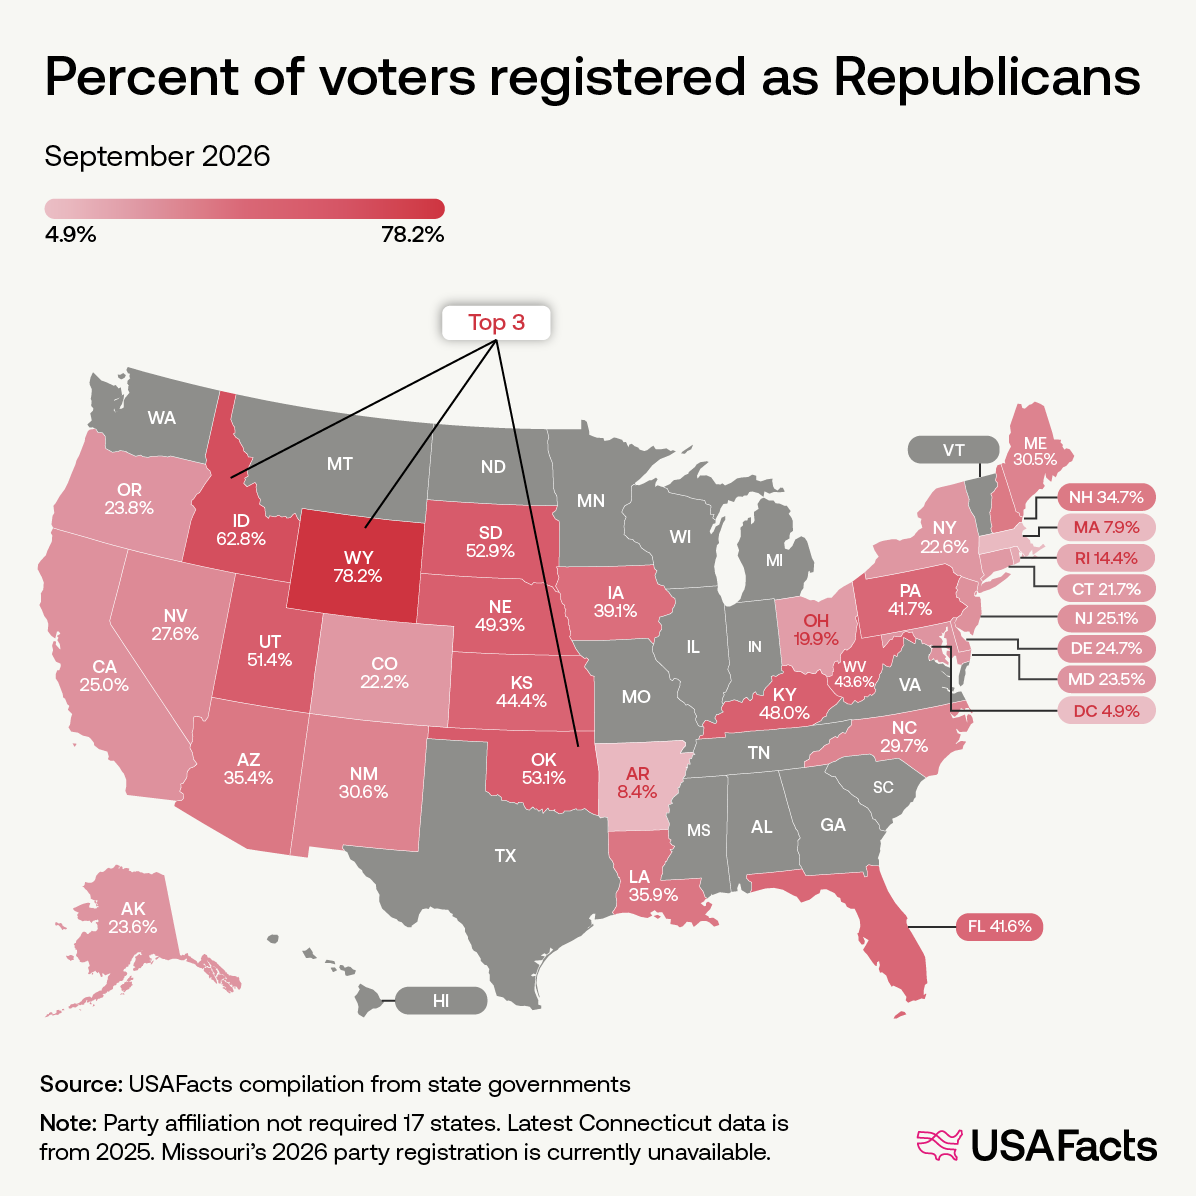
Seventeen states don’t require an affiliation on voter registration forms. These include some of the most populous states in the country, including Texas and Illinois. But among states that do, the data shows there were 39.1 million registered Republicans as of September.
|
|
Wyoming has the highest percentage of registered Republicans (78.2%). The largest numbers of registered Republicans are in California (5.8 million, or 25.0% of the state’s registered voters) and Florida (5.6 million, or 41.6%). These are also the country’s most-populated and third-most-populated states, respectively.
|
|
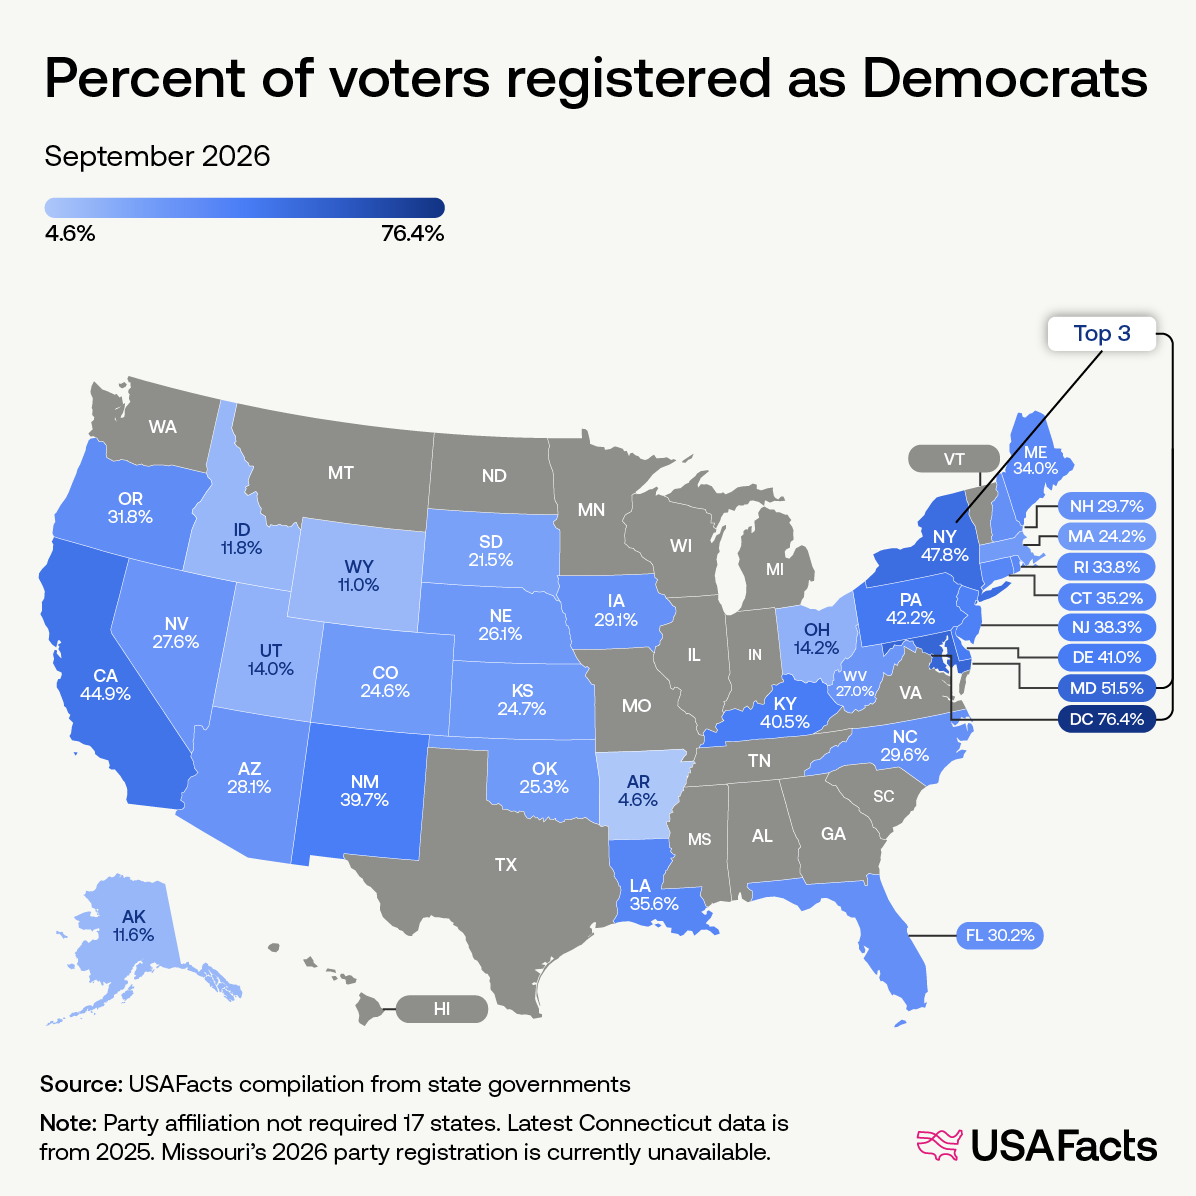
The nation has around 45.3 million registered Democrats as of September. Washington, DC, has the highest percentage: 76.4%. Maryland had the highest of any state at 51.5%. The largest numbers are in California (10.4 million or 44.9% of the state’s registered voters) and New York (6.0 million, or 47.8%).
Forty-two million voters have no affiliation, are undeclared, or are registered as independents. Arkansas has the highest percentages of party-agnostic voters (87.0% of voters in the state), followed by Massachusetts (67.1%), and Ohio (65.7%).
|
|
Teach high school? Join our OER Fellowship |
|
Build a classroom lesson plan with real government data as part of our Open Educational Resources fellowship with the Institute for the Study of Knowledge Management in Education. Apply by November 4! |
|
A sixteen-year-old gunman killed three children and one adult at a school in Bend, Oregon, last Thursday. Casualties from active shooter incidents increased 57% from 2024 to 2025. Fresh data shows that housing was the main driver of inflation from September 2025 to September 2026. Meanwhile, transportation prices (which include vehicles, parts, and fuel) were 7.9% higher than a year before. Track the numbers. Voting laws, political polarization, the makeup of Congress: Americans have questions that require civic data ahead of the midterms. We’ve collected these answers and cool visualizations here. Did you keep up with last week’s newsletter? Then take the weekly fact quiz. |
|
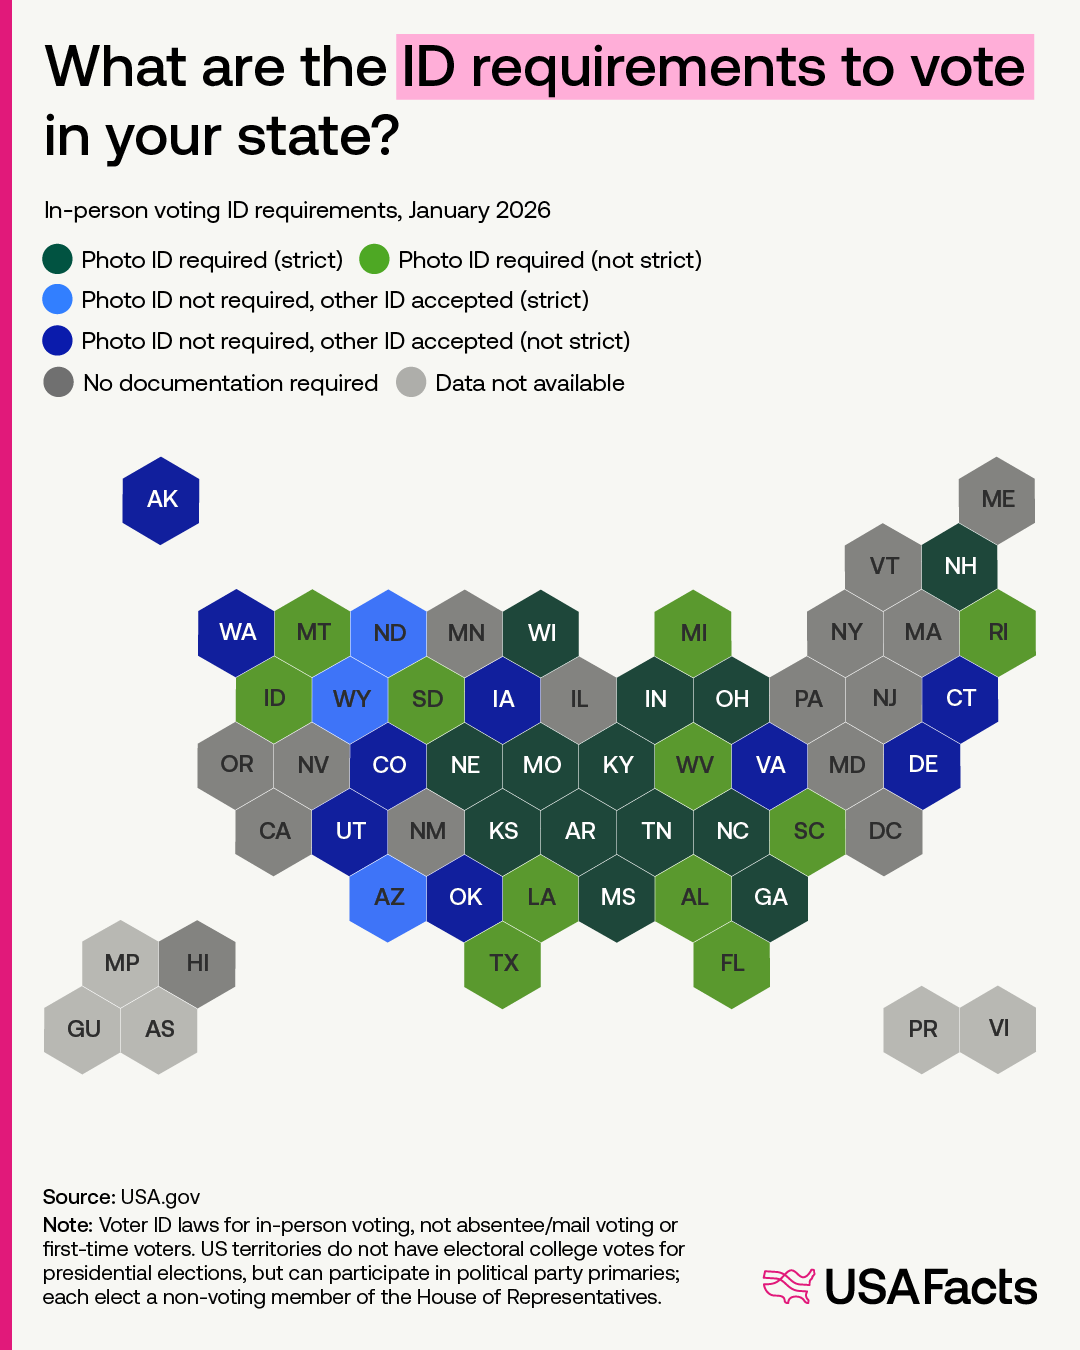
All states require some form of identification when registering to vote. But what about voting in person on Election Day? Twenty-four states require photo ID to vote in person, and 12 accept alternative forms of ID. Fourteen states and Washington, DC, do not require voters to show ID at the polls if they have voted before. |
|
Was this email forwarded to you? Sign up for your own weekly issue of the USAFacts newsletter. |
|
|
|
|