Your MRR, revenue and KPIs from the warehouse, on any Mitzu chart or dashboard. ͏  ͏  ͏  ͏  ͏  ͏  ͏  ͏  ͏  ͏  ͏  ͏  ͏  ͏  ͏  ͏  ͏  ͏  ͏  ͏  ͏  ͏  ͏  ͏  ͏  ͏  ͏  ͏  ͏  ͏  ͏  ͏  ͏  ͏  ͏  ͏  ͏  ͏  ͏  ͏  ͏  ͏  ͏  ͏  ͏  ͏  ͏  ͏  ͏  ͏  ͏  ͏  ͏  ͏  ͏  ͏  ͏  ͏  ͏  ͏  ͏  ͏  ͏  ͏  ͏  ͏  ͏  ͏  ͏  ͏  ͏  ͏  ͏  ͏  ͏  ͏  ͏  ͏  ͏  ͏  ͏  ͏  ͏  ͏  ͏  ͏  ͏  ͏  ͏  ͏  ͏  ͏  ͏  ͏  ͏  ͏  ͏  ͏  ͏  ͏  ͏  ͏  ͏  ͏  ͏  ͏  ͏  ͏  ͏  ͏  ͏  ͏  ͏  ͏  ͏  ͏  ͏  ͏  ͏  ͏ ­ ­ ­ ­ ­ ­ ­ ­ ­ ­ ­ ­ ­ ­ ­ ­ ­ ­ ­ ­ ­ ­ ­ ­ ­ ­ ­ ­ ­ ­ ­ ­ ­ ­ ­ ­ ­ ­ ­ ­ ­ ­ ­ ­ ­ ­ ­ ­ ­ ­ ­ ­ ­ ­ ­ ­ ­ ­ ­ ­ ­ ­ ­ ­ ­ ­ ­ ­ ­ ­ ­ ­ ­ ­ ­ ­ ­ ­ ­ ­ ­ ­ ­ ­ ­ ­ ­ ­ ­ ­ ­ ­ ­ ­ ­ ­ ­ ­ ­ ­ ­ ­ ­ ­ ­ ­ ­ ­ ­ ­ ­ ­ ­ ­ ­ ­ ­ ­ ­ ­ ­ ­ ­ ­ ­ ­ ­ ­ ­ ­ ­ ­ ­ ­ ­ ­ ­ ­ ­ ­ ­ ­ ­ ­ ­ ­ ­ ­ ­ ­ ­ ­ ­ ­ ­ ­ ­ ­ ­ ­ ­ ­ ­ ­ ­ ­ ­ ­ ­ ­ ­ ­ ­ ­ ­ ­ ­ ­ ­ ­ ­ ­ ­ ­ ­ ­ ­ ­ ­ ­ ­ ­ ­ ­ ­  

Mitzu_logotype_box_melon_gradient (1)

Today's drop: Warehouse Metrics 📊

Hi there,


Day 2 of Mitzu Launch Week.


Today: Warehouse Metrics (formerly Metric Tables). Define your own metrics and KPIs in your data warehouse, then visualize them in Mitzu on any chart or dashboard.


Not every number your company cares about starts as an event. Revenue, MRR, active subscriptions and support tickets usually live in tables your data team already maintains, often as dbt models. Now they sit right next to the behaviour that moves them.

1. Point Mitzu at a table you already have

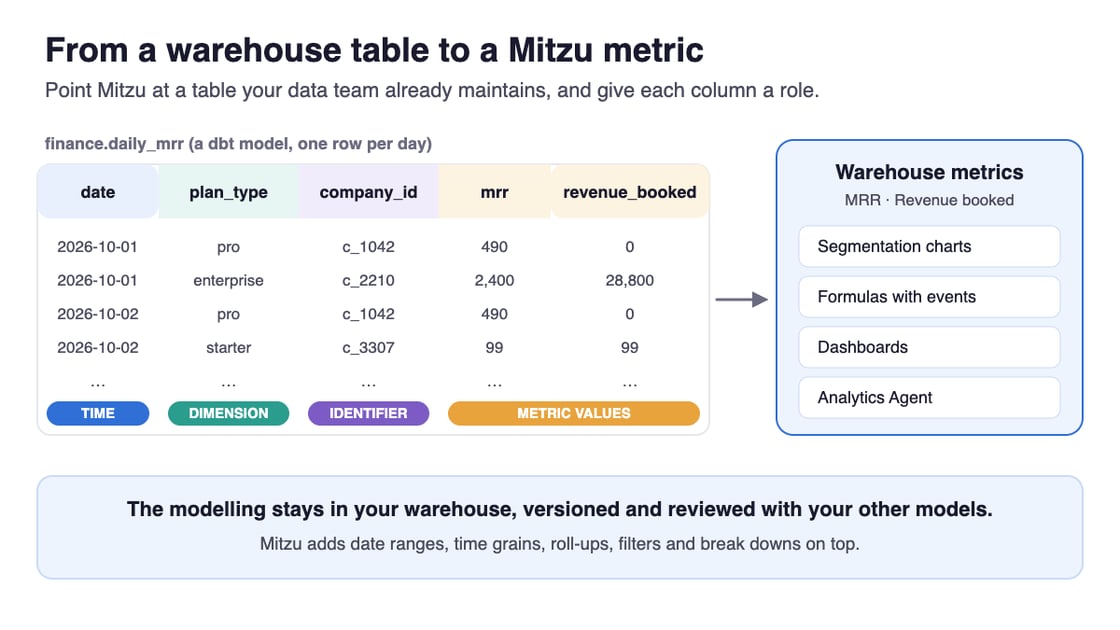
Pick a table or view and give each column a role: the time column, metric values, dimensions, and identifiers such as company_id. Every value column becomes a metric. The modelling stays in your warehouse, versioned and reviewed with the rest of your models.

Diagram: a daily MRR dbt model with columns date (time), plan_type (dimension), company_id (identifier), mrr and revenue_booked (metric values) becomes warehouse metrics used in charts, formulas, dashboards and the Analytics Agent

2. Roll-ups that make sense

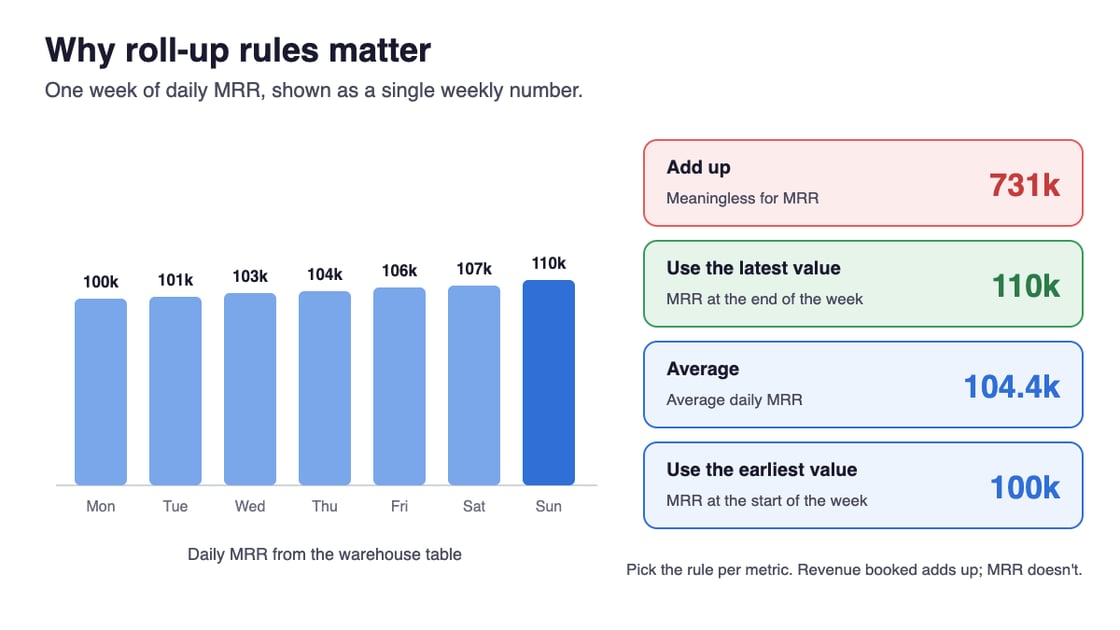
Each metric gets a roll-up rule, so weekly and monthly views mean what they should. Revenue adds up, MRR uses the latest value, and you can also pick average, median, P75, P90, lowest or highest. Monthly MRR is the last day's MRR, not the sum of thirty days of it.

Chart of one week of daily MRR rolled up four ways: Add up gives 731k (meaningless for MRR), Use the latest value gives 110k, Average gives 104.4k and Use the earliest value gives 100k

3. Right next to your product data

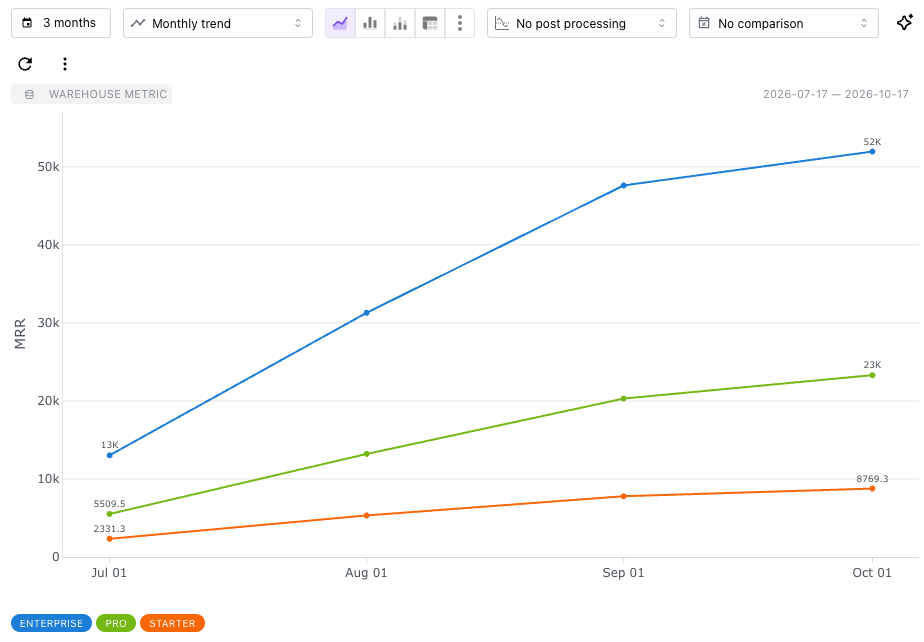
Warehouse metrics show up in the segmentation event picker and break down by any property of the company or user they belong to. Combine them with event metrics in a formula, such as revenue per active user, put them on a dashboard, or just ask the Analytics Agent: "What was our MRR by plan in September?"

A Mitzu chart of the warehouse metric MRR broken down by plan as a monthly trend: Enterprise grows from 13K to 52K, Pro from about 5.5K to 23K and Starter from about 2.3K to 8.8K

Mitzu queries the table in place, the same way it reads your events. Nothing is copied out of your warehouse.

See it in action

Warehouse metrics in Mitzu: finance numbers next to your event data

📖 The full story, with a step-by-step guide from a dbt model to a chart, is on our blog: Warehouse Metrics: Your dbt KPIs Next to Your Product Data


Every setting is covered in our docs.


Three more drops this week. Tomorrow: Mitzu's AI, on your terms and on your bill.

Try Warehouse Metrics

Mitzu, Inc., 3500 South Dupont Highway, Dover, Delaware 19901, United States

Unsubscribe Manage preferences